Long context costs memory, and the standard advice for getting it back is to quantize the KV cache. Ollama exposes it as one environment variable. The framing is always the same: you trade some quality for a smaller cache.
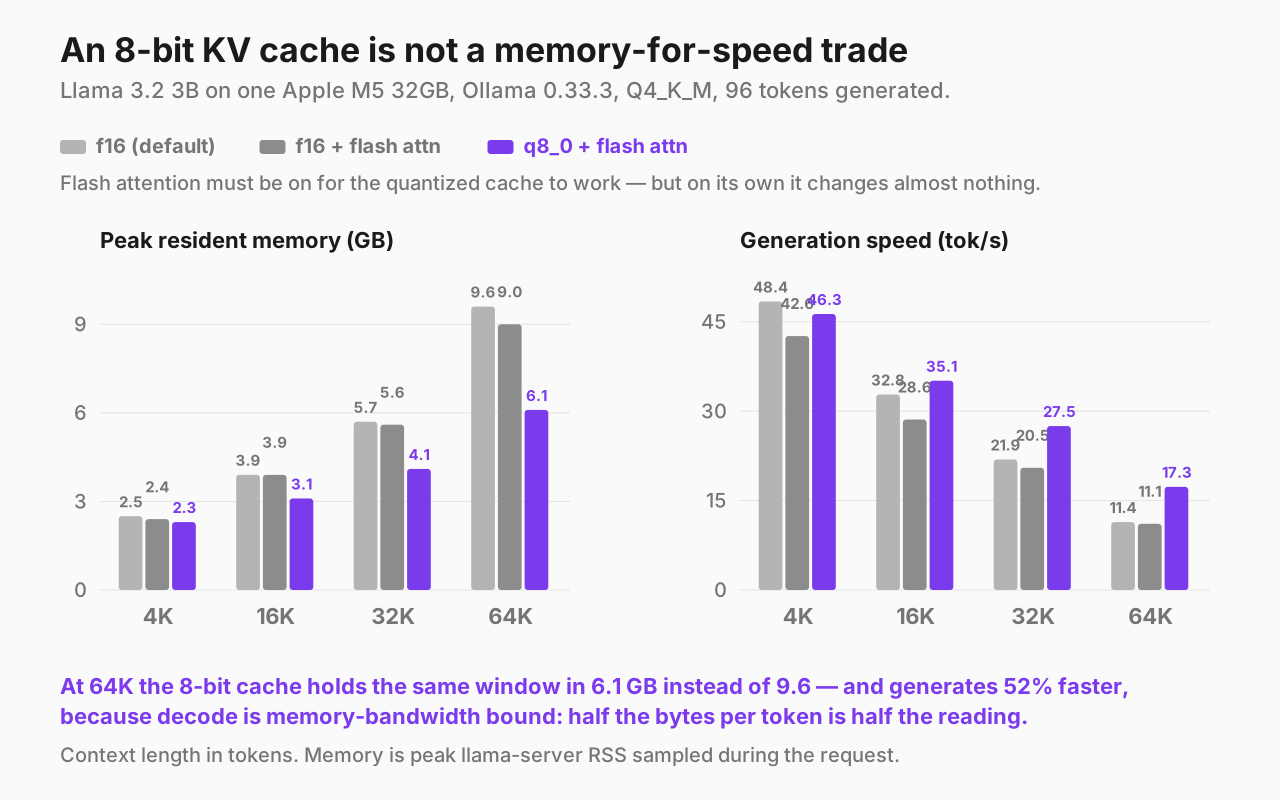
On this machine that framing is wrong in an interesting way. An 8-bit cache did shrink memory — 9.6GB down to 6.1GB at 64K — but it also made generation 52% faster, and across every output I compared it did not change what the model wrote.
This is the follow-up to the four-model long-context comparison, where I said plainly that I had not measured this. Now I have.
What the setting is
Ollama stores keys and values at fp16 by default. Two environment variables change that:
OLLAMA_FLASH_ATTENTION=1
OLLAMA_KV_CACHE_TYPE=q8_0
Both are server-level, so they take effect when ollama serve starts, not per request. You can confirm they landed by reading the startup log — Ollama prints its whole config:
grep -o "OLLAMA_KV_CACHE_TYPE:[a-z0-9_]*" ~/.ollama/logs/server.log | tail -1
The two are coupled in practice: on most builds the quantized cache needs flash attention on. That coupling is why I measured three configurations rather than two — otherwise there is no way to say which one is doing the work.
The three configurations
Same Apple M5 MacBook Pro with 32GB, Ollama 0.33.3, Q4_K_M weights, machine otherwise idle, 96 tokens generated per cell with the prompt filling 94–99% of the window.
Llama 3.2 3B — full attention, memory in GiB · generation in tok/s:
| Context | f16 (default) | f16 + flash attn | q8_0 + flash attn |
|---|---|---|---|
| 4K | 2.5GB · 48.4 | 2.4GB · 42.6 | 2.3GB · 46.3 |
| 16K | 3.9GB · 32.8 | 3.9GB · 28.6 | 3.1GB · 35.1 |
| 32K | 5.7GB · 21.9 | 5.6GB · 20.5 | 4.1GB · 27.5 |
| 64K | 9.6GB · 11.4 | 9.0GB · 11.1 | 6.1GB · 17.3 |
Gemma 3 4B — sliding-window attention:
| Context | f16 (default) | f16 + flash attn | q8_0 + flash attn |
|---|---|---|---|
| 4K | 4.7GB · 42.8 | 4.7GB · 39.6 | 4.3GB · 34.3 |
| 16K | 5.1GB · 39.4 | 5.0GB · 36.8 | 4.7GB · 39.5 |
| 32K | 5.5GB · 35.5 | 5.4GB · 33.9 | 4.9GB · 36.5 |
| 64K | 6.1GB · 29.2 | 5.5GB · 26.7 | 5.4GB · 32.5 |
Flash attention is not where the gain comes from
Compare the first two columns. On Llama 3.2 at 64K, turning flash attention on by itself moved memory from 9.6GB to 9.0GB and generation from 11.4 to 11.1 tok/s — a rounding error on memory and slightly worse on speed. On Gemma 3 4B it was the same story: 6.1GB to 5.5GB, and 29.2 to 26.7 tok/s, which is 9% slower.
So on this hardware flash attention on its own is neutral at best. You still have to turn it on, because the quantized cache needs it, but if you enable it alone and see nothing change, that is the expected result and not a misconfiguration.
Everything that follows comes from the cache type.
What the cache quantization actually buys
The useful number is not total memory — it is the slope, how much each additional thousand tokens of context costs.
| Model | Config | Cache growth per 1K tokens |
|---|---|---|
| Llama 3.2 3B | f16 | 118 MiB |
| Llama 3.2 3B | f16 + flash attn | 110 MiB |
| Llama 3.2 3B | q8_0 | 63 MiB |
| Gemma 3 4B | f16 | 23 MiB |
| Gemma 3 4B | q8_0 | 18 MiB |
Llama 3.2's slope drops to 57% of the fp16 figure. Halving the bytes per entry should halve the slope, and 57% is close enough that the residue is plainly the parts of the footprint that are not cache — compute buffers, which quantization does not touch.
Gemma 3 4B gains much less, and that is exactly what its architecture predicts. Five of its thirty-four layers keep growing with context; the other twenty-nine stop at a 1,024-token window. There is simply less cache to compress. Cache quantization pays in proportion to how much cache you had, which means it helps the models that need help most.
The part I did not expect: it got faster
At 64K, Llama 3.2 went from 11.4 tok/s to 17.3 — 52% faster while using 36% less memory. Gemma 3 4B went from 29.2 to 32.5, up 11%.
This is not mysterious once you look at where decode time actually goes. Generating one token requires reading the entire cache. Decode is memory-bandwidth bound, not compute bound, so halving the bytes you must stream per token buys you speed directly. The effect scales with cache size, which is why Llama 3.2 gains 52% at 64K and only a few percent at 4K, and why Gemma 3 — whose cache barely grows — gains little at any length.
The usual mental model has cache quantization as a memory optimization with a speed cost. On a memory-bandwidth-bound decode step it is the opposite.
Does the output change?
It must, arithmetically — you are storing less precise numbers. The question is whether it shows. I ran two checks. Neither is a quality benchmark, and I will be explicit about what they do and do not establish.
Short prompts, temperature 0. Six prompts (arithmetic, code, factual recall, summarization) through Llama 3.2 at 8K context under each cache type, greedy decoding with a fixed seed, outputs compared byte for byte.
Five of six were identical. The sixth diverged 139 characters in:
f16 : …checked, and sequential delivery of data, whereas UDP…
q8_0: …checked, and sequential delivery of data packets, whereas UDP…
Both are correct. The quantization changed a word, not an answer.
Needle retrieval at 64K. Short prompts barely fill the cache, so they are a weak test of a cache setting. The harder version: hide three distinct facts at 10%, 50% and 90% depth in a 65,032-token prompt, then ask for all three in one request.
| Cache | 10% depth | 50% depth | 90% depth |
|---|---|---|---|
| f16 | found | found | found |
| q8_0 | found | found | found |
Both retrieved all three, and the two responses were byte-identical — same access code, same date, same volume, same sentences.
What this does not establish. Needle retrieval is the easiest long-context task there is; passing it does not mean reasoning holds up. I did not measure perplexity, did not run a benchmark suite, and tested two models on one machine in English. If your workload is long-context code generation or multi-step reasoning, my result is a reason to try the setting, not evidence that it is free for you.
What I can say is narrower and still useful: across every output I compared, an 8-bit cache did not change what these models wrote.
So should you turn it on?
If you run long context on a memory-constrained machine, yes — measure it on your own workload first, but the default of fp16 is costing you memory and speed both.
The gain is proportional to how much cache you have:
- Full-attention models at long context are where it matters. Llama 3.2 at 64K gets back 3.5GB and 52% of its speed. That is the difference between a 3B model eating a third of a 32GB machine and eating a fifth.
- Sliding-window models gain little because they had little cache to start with. Gemma 3 4B saves 0.7GB at 64K. Worth turning on, not worth planning around.
- Short context gains nothing. At 4K the cache is a rounding error and quantizing it does nothing measurable.
One thing it does not do: change the shape of the problem. A full-attention model with an 8-bit cache still grows linearly, just at half the rate. It buys you one doubling of context, not a different slope. The architecture comparison is still the decision that matters more.
Measuring it yourself
The whole thing is two servers and one script. The trick that makes it painless: do not restart the server you use every day. Start a second one on another port with the settings you want to test, and point the measurement at it.
# 측정 전용 서버 — 평소 쓰는 11434 는 건드리지 않는다
OLLAMA_HOST=127.0.0.1:11435 \
OLLAMA_KV_CACHE_TYPE=q8_0 \
OLLAMA_FLASH_ATTENTION=1 \
  ollama serve &

OLLAMA_HOST=http://127.0.0.1:11435 node your-measure-script.mjs
Three things to get right, all of which I got wrong first:
Check that the setting landed. Ollama prints its entire resolved config on startup. Read it rather than trusting that your export worked:
grep -o "OLLAMA_KV_CACHE_TYPE:[a-z0-9_]*" ollama-server.log | head -1
Fill the window. If your prompt overshoots num_ctx, Ollama silently truncates it to exactly half the window with no error — every row comes back at num_ctx / 2 + 2 tokens. Check prompt_eval_count against num_ctx on every response. A cache setting measured on a half-empty cache tells you nothing.
Generate enough tokens. num_predict is a maximum, not a target. If the model stops after two or three tokens, the rate you compute is dominated by the first token arriving off a freshly warm prefill. On this model at 16K, a 3-token sample reads 38.9 tok/s against a true 28.7. Generate a few dozen at minimum and check eval_count.
Those last two cost me two full sweeps in the previous article, which documents them in more detail.
For the output comparison, run the same prompts at temperature: 0 with a fixed seed under each server and diff the responses as strings. Greedy decoding makes the comparison exact: if the cached numbers are equivalent, the token stream is identical, so any divergence is the quantization showing up.
FAQ
Is q8_0 the only option?
Ollama accepts other cache types, and q4_0 exists. I measured only q8_0 because it is the conservative step — halving precision from fp16 is a change I could check the output against. A 4-bit cache halves memory again and is a materially larger perturbation; I have no data on it and would not assume my results transfer.
Why does flash attention make things slower here?
I do not have a confirmed explanation, and the effect is small — 3% on Llama 3.2, 9% on Gemma 3 4B at 64K. It is enough to say that on Apple Silicon with this runtime, flash attention is not the optimization; it is the prerequisite for the one that is.
Does this help prefill too?
Barely. Llama 3.2's prefill at 64K went 138.1 tok/s (f16) to 172.0 (q8_0), and Gemma 3 4B's went 717.3 to 660.2 — better on one, worse on the other. Prefill is compute bound, so shrinking the cache does not help the way it helps decode. Reading a long prompt still takes as long as it takes.
Will this change my model's answers?
In every comparison I ran it did not — five of six short prompts byte-identical, and a 64K needle test identical on all three depths. But I tested two models, in English, on retrieval and short generation. Run your own prompts at temperature: 0 under both settings and diff them; it takes a few minutes and it is the only answer that applies to your workload.
What about quality benchmarks?
I did not run any. Perplexity or a benchmark suite would be the rigorous version of the output check above, and it is the obvious next measurement. Until someone does it, "I compared the outputs and they matched" is a weaker claim than "quality is unaffected," and I am making the weaker one deliberately.
References
OLLAMA_KV_CACHE_TYPEandOLLAMA_FLASH_ATTENTIONand their defaults: read fromollama serve --helpon Ollama 0.33.3, and confirmed in the server's own startup config dump- Model architecture values (layer counts, KV head counts, head dimensions, sliding window) were read from each model's GGUF metadata via
POST /api/show, not from documentation - Gemma 3's 5:1 local-to-global interleaving and 1,024-token window: Google Developers Blog · Gemma 3 Technical Report