Series: TRELLIS.2 on Apple Silicon (3/3) ← Part 1 · The Port — ← Part 2 · Measuring and the Dead Ends — Part 3 · What Actually Won (this post)
Every one of the five bottlenecks I picked in Part 2 was wrong. So where did the wins actually come from? The optimizations that survived all came from the same unglamorous place — making the machine not do work it didn't need to do. And at the very end, there was a twist that overturned even my own conclusion from Part 2.
A. Conditional checkpoint loading — don't even load the models you won't use
I found this during an exhaustive survey. from_pretrained was loading all 8 checkpoints (13.8GB) regardless of pipeline_type (the per-resolution pipeline kind — 512/1024/1024_cascade). But the default 512 pipeline loads and never once uses the two *_1024 flow models (4.8GB). I patched it to load only the set actually needed for each pipeline_type.
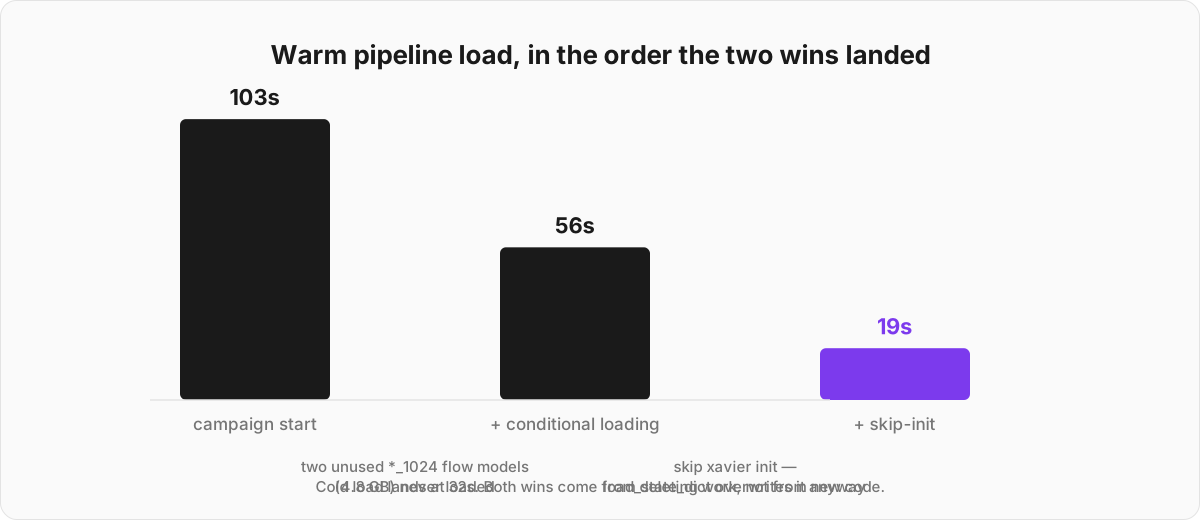
That single change took warm pipeline load from about 103s down to about 56s, without a line of new kernel code. That remaining 56s is where the next section picks up.
B. skip-init — the real culprit behind load time wasn't disk, it was CPU
At first I was investigating "loading is slow, so let's hide the load behind sampling" (background loading). Then I broke the load cost down and measured it, and the picture that came back was nothing like what I'd expected.
Broken down for the flow model, the load cost splits like this:
- construct +
initialize_weights()(xavier init — the initialization that scatters random weights before training begins): 20–70s - reading the safetensors file: 0.03–0.2s
- applying
load_state_dict: 1–7s
Almost the entire load time was not file I/O but weight initialization. And the result of that xavier init gets wholesale overwritten by the very next line, load_state_dict. In other words, pure waste. We were bothering to randomly initialize first, when we were about to load from a checkpoint anyway.
On top of that, this init consumes the global RNG. Had I gone ahead with the background loading I originally planned, the init's RNG draw would have raced against the sampler's noise draw and could have deformed the mesh. So I dodged a dangerous path too.
The fix wasn't threads — it was deletion. On checkpoint load, monkeypatch initialize_weights into a no-op and restore it in finally. I verified that the parameters are bit-identical and the output mesh is bit-identical too (tools/bench/test_skipinit.py). Without a single thread, I got a bigger win than the background loading I'd set out to build.
Load time: 56s → 19s (warm) / 32s (cold) — measured on top of the conditional loading in section A, which had already brought the 103s campaign-start load down to ~56s. You can opt out with SKIP_INIT_ON_LOAD=0.
Stacked, the two take warm load from about 103s → 19s. Load fell to under a fifth, and I didn't write a single new line of kernel. I just stopped doing work that didn't need doing.
C. CFG batching — and the story of the win coming from the opposite side of where I expected
I found this in a structural review. Classifier-free guidance (CFG) runs the cond forward and the neg-cond forward sequentially, twice at every guided step. Fold those two into a single forward with batch 2 and the computation is mathematically identical.
Counting the guided steps in the 512 pipeline: structure 10/12, shape 9/12, texture 0/12 (strength=1.0, so it's a single pass to begin with). I batch dense with torch.cat, sparse with SparseTensor.from_tensor_list, and split the result back out by layout.
In a single step, the max|diff| between batched and sequential was 0.0 (bit-identical) — which is exactly what you'd see if nothing bled across the batch dimension (the concern being that things like norms mix across it). Result: generation 197.3s → 181.9s (−7.8%), mesh bit-identical.
Here's the most interesting twist. I expected most of the gain to come from the most expensive stage, dense structure. In reality, dense structure only shed 3s, and most of the gain (~12s) came from the sparse stages.
The reason is GPU utilization. Dense attention (~4096 tokens) already saturates the GPU at B=1. So making it B=2 just doubles the work, and all you earn back is roughly the kernel-launch overhead. Sparse attention (~1477 tokens; shoe-era sample — the Brighella sample runs 1,591, see the baseline note below), on the other hand, leaves the GPU idle at B=1 (under-utilized).
There, B=2 rides along almost for free. Contrary to the "batch bigger to win on the big one" intuition, the gain came from the small, less-busy side. You can opt out with CFG_BATCH=0.
D. Step count — do we really need all 12 steps?
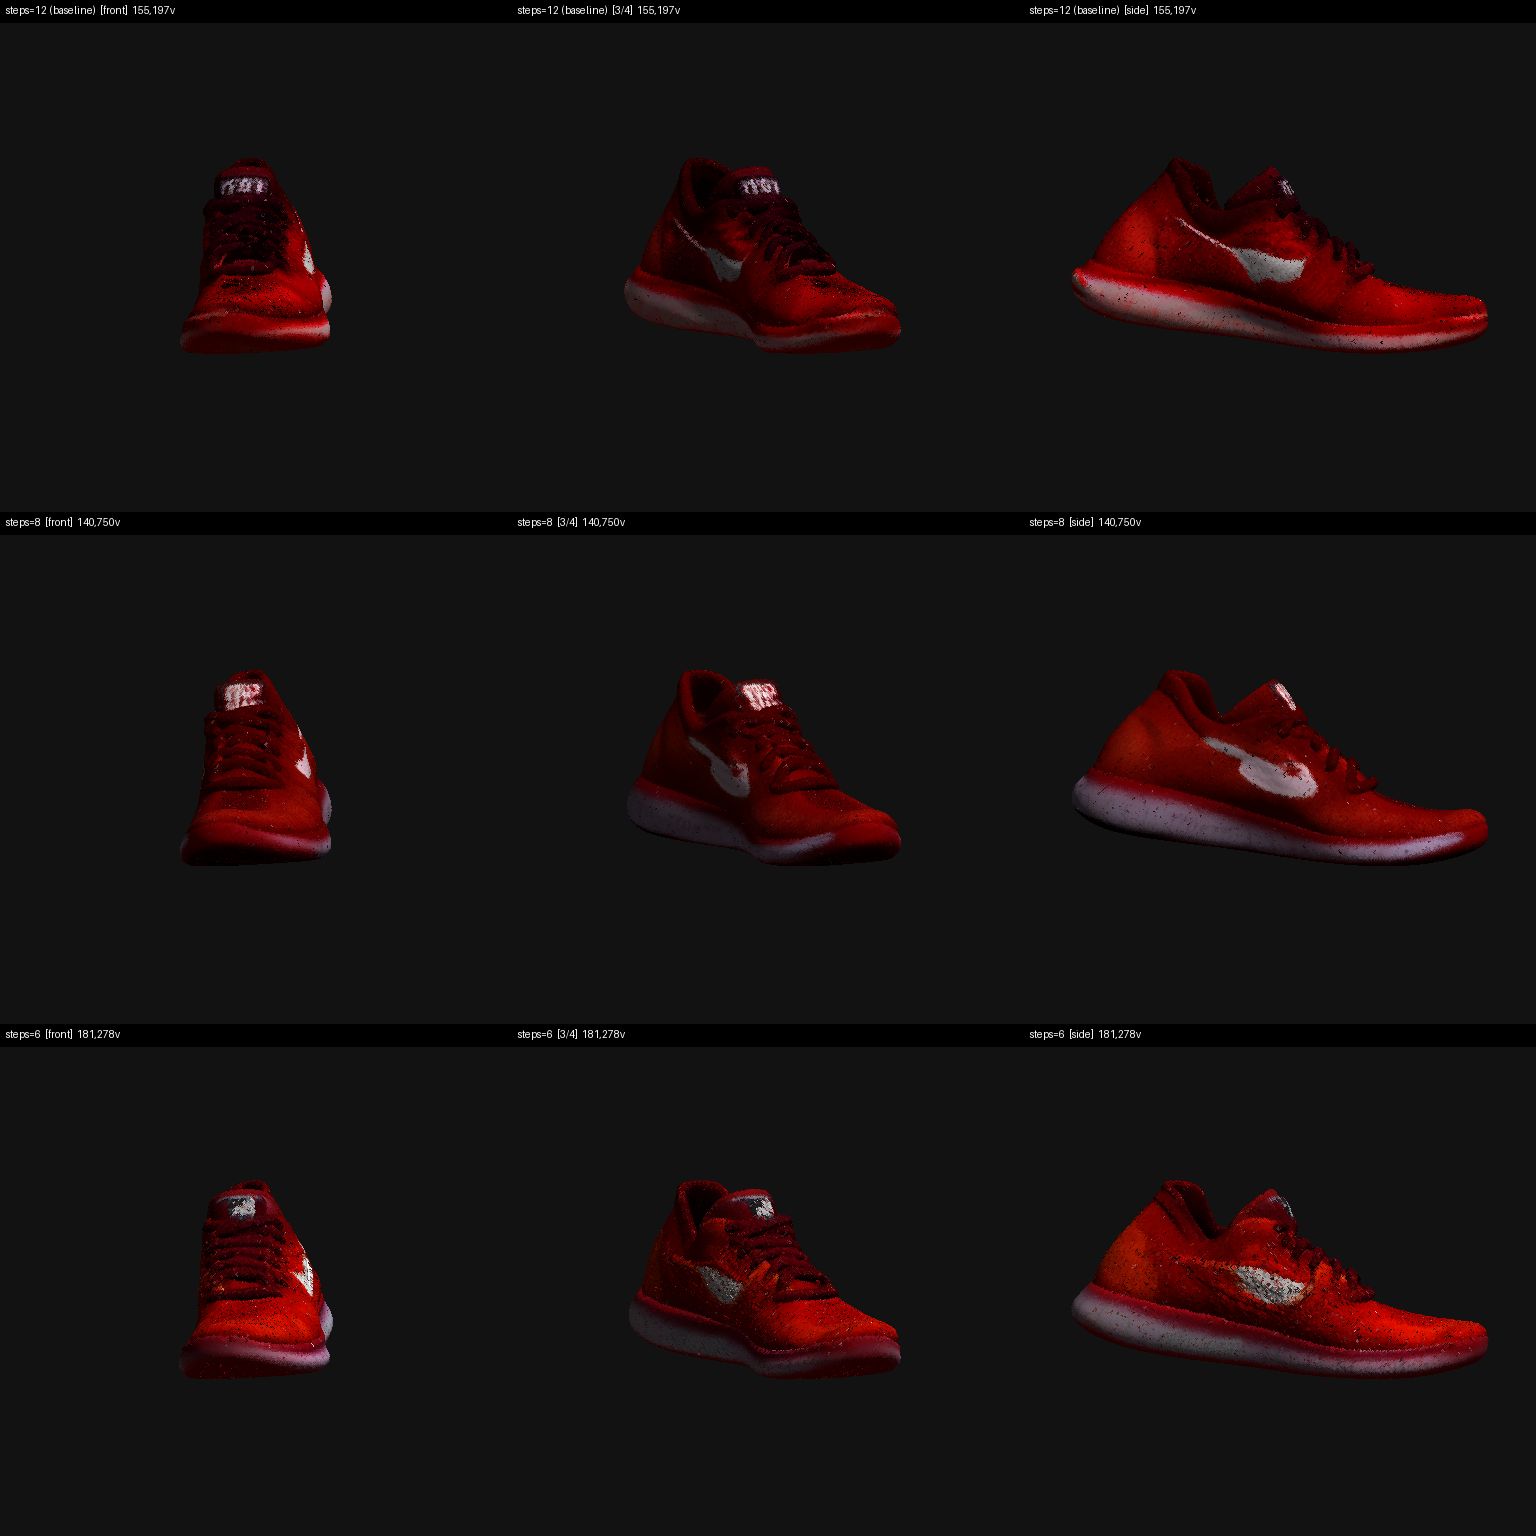
This one was an experiment that re-measured a tradeoff with no code change. I varied the sampler step count across 12/8/6 and compared renders on the same seed.
| steps | generation time (heat-normalized) | visual quality |
|---|---|---|
| 12 | 203s (baseline) | baseline |
| 8 | 124s (−39%) | nearly indistinguishable from 12 |
| 6 | ~105–110s (−46 to −48%) | usable but surface noise / rougher |
steps=8 was the sweet spot. Generation drops 39% while the quality loss is hard to spot. (These runs, like everything in A–D, still used the shoe sample — the render below is that shoe, and the baseline note right after this section explains the switch.) I keep the default safely at 12 but documented --steps 8 as a fast mode.
(steps=6 adds surface speckle and smears detail, so I only recommend it when you need maximum speed and can accept the roughness.)
That covers the lossless optimizations (A–C), plus one tradeoff I measured but didn't adopt as default (D). Load went from 103s to 19s; generation dropped nearly 8% from CFG batching. I originally meant to close the post here. But the campaign kept turning things over after that.
Wait — the baseline for the numbers changes here
From here down the measurement baseline shifts, so let me flag it first. All the numbers in A–D above (mesh 427,301 / 865,664) come from the era when I was using a shoe image as the sample.
That shoe image was derived from upstream and had a Nike logo on it, so when I decided to open-source the project I replaced it with a CC0 public-domain image I hold the rights to — the Metropolitan Museum of Art's "Brighella on a pedestal."
Change the sample and of course the mesh fingerprint changes too. The shoe's 427,301 / 865,664 becomes Brighella's roughly 512,000 / 1,056,000 range. So don't be surprised if the mesh numbers in the new experiments below look nothing like the ones above — it's a different photo.
And here I learned something I didn't see coming. Around the same time I recreated .venv (unavoidable — I was reorganizing the folder structure), and with the input and the code both unchanged, the gate mesh count nudged from 512,278 / 1,056,692 to 512,320 / 1,056,832. Even though the torch version (2.12.1) was identical.
Somewhere in the dependency tree, an upstream floating-point op had shifted ever so slightly. It's a change I'd never have noticed if I hadn't clamped a determinism gate down hard.
The lesson was clear. Reproducibility isn't achieved by pinning the code alone. So I froze the verified environment into requirements.lock, pinned upstream TRELLIS.2 to a commit (TRELLIS2_COMMIT), and nailed down the rule "re-establish the gate first whenever you rebuild the venv." Without this annoying discovery, I'd have mistaken the tiny mesh shifts in the experiments below for a "bug" and burned days on it.
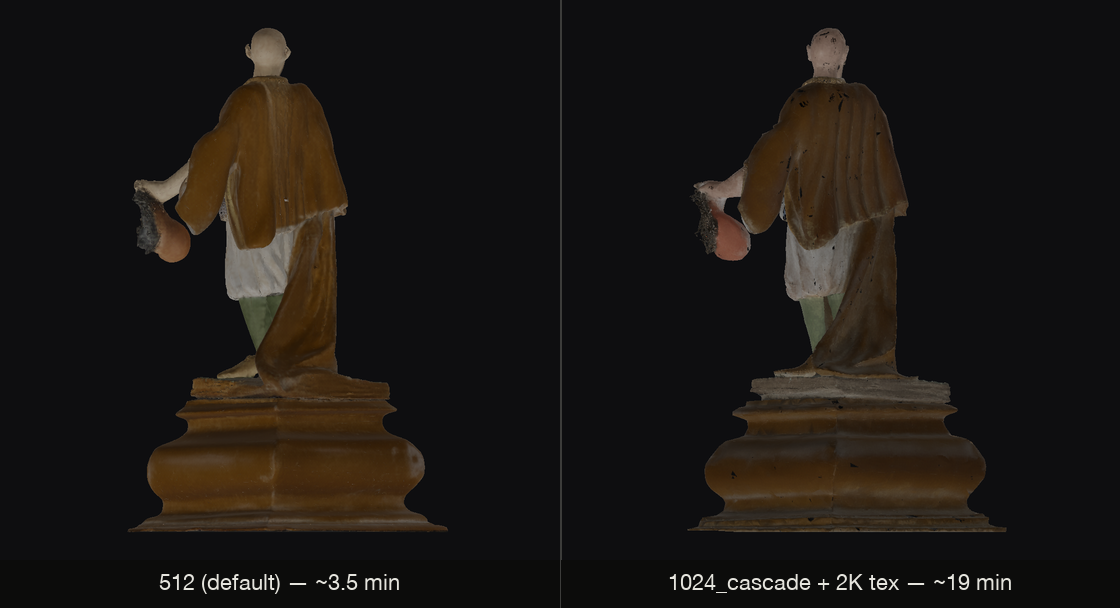
Here is that new sample, and what the two pipelines make of it — the default 512 run against the 1024_cascade with 2K textures.
E. Vectorizing mesh extraction — 67×
In Part 1 I mentioned reimplementing the CUDA hashmap as a pure-Python dict. That was slow. This stage — turning the dual voxel grid into a mesh — was eating 8.8s on real-scale input.
The cause was the Python dict loop. With coordinates as keys, looked up one at a time, it walks hundreds of thousands of voxels at the Python level. I vectorized the whole thing — pack the coordinates injectively into a single int64, then replace the dict lookups with array operations via torch.unique and searchsorted.
Result: extraction 8.8s → 0.13s. About 67×. I verified equivalence with 38 synthetic cases + 3 E2E runs (vectorized implementation vs original dict implementation output match). Those 38 went straight into the test suite afterward, so tests/test_mesh_extract.py keeps guarding the equivalence of the two implementations.
F. Bake decimation cap — testing an inherited assumption
In Part 1 I wrote that "the Metal BVH … builder is known to be unstable on large inputs, so before baking I pre-reduce it to roughly 200K faces with fast_simplification." That 200K cap sets the geometry ceiling of the final GLB.
But the specific unstable above 800K threshold isn't something Part 1 ever measured — it's a premise inherited from the mtlbvh upstream, which documents instability above 800K faces. I tested whether it holds on my machine (M-series / 32GB).
I opened the decimation cap as an environment variable (BAKE_MAX_FACES, default 200,000) and ran bakes cranking it up to 400K / 600K / 800K / no decimation (1.06M).
| cap | bake time | result |
|---|---|---|
| 200K (default) | 9s | stable |
| 400K | 22s | stable |
| 600K | 30s | stable |
| 800K | 91s | stable |
| no decimation (1.06M) | 120s | stable |
One caveat about what this table actually tests: only the last row, no decimation (1.06M), goes past the 800K threshold at all — and it's a single run on a single machine. The rows below it show the cost curve, not counter-evidence about the premise.
Instability above 800K did not reproduce.
On this machine everything baked cleanly, all the way up to no decimation.
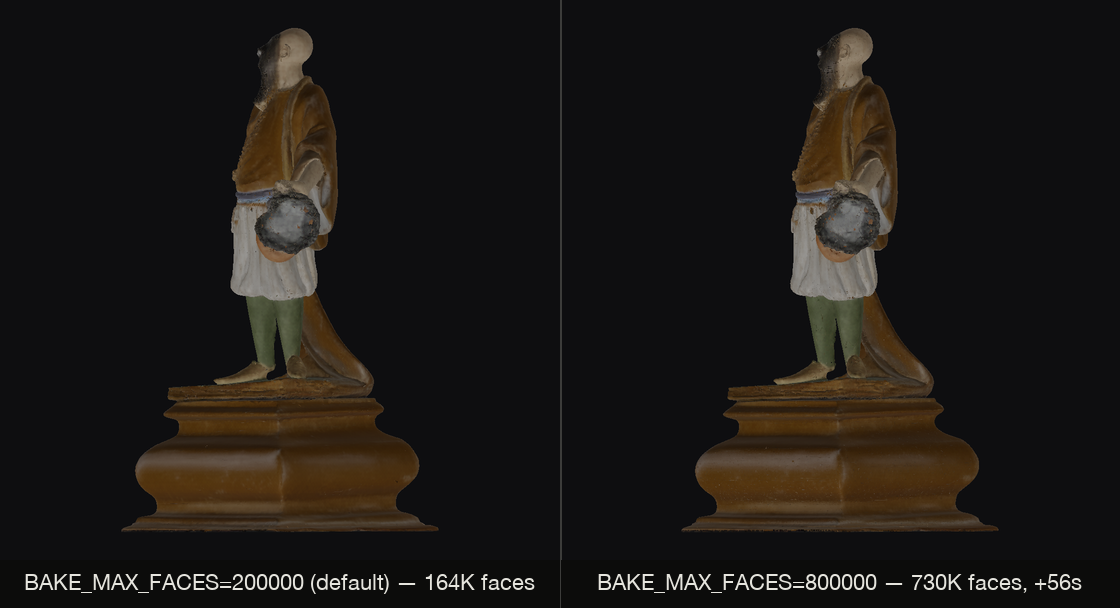
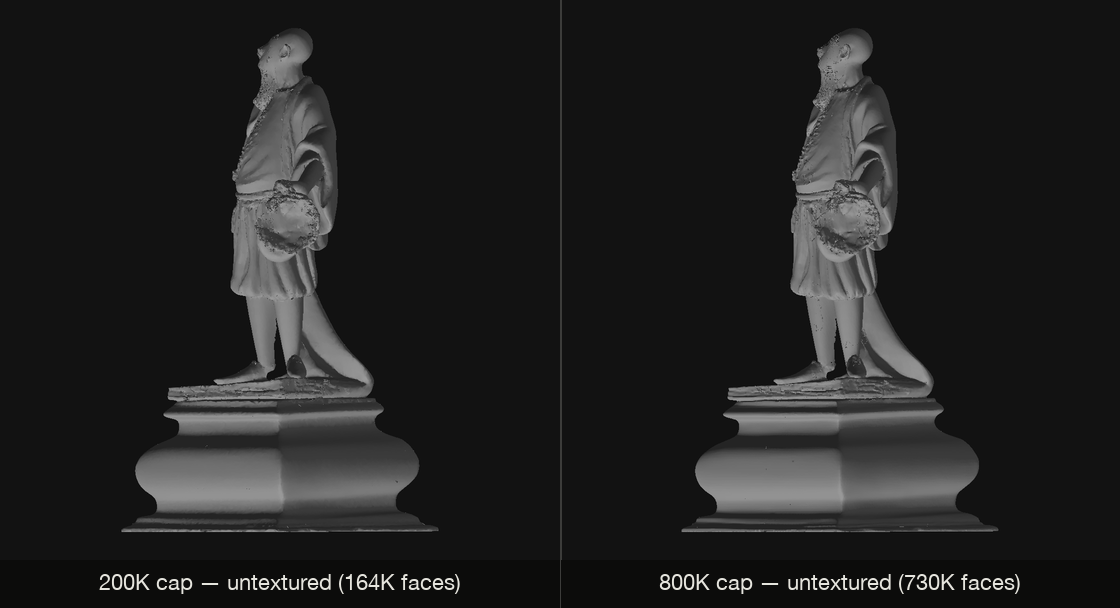
I put an 800K cap on the heavier 1024_cascade pipeline (which, baked at the default 200K cap, leaves about 164,000 faces in the final GLB), and 730,000 faces survived into the GLB — about 4.4× the default. The drape (fabric folds) came out visibly better and there was less surface pitting, and the bake cost +56s over the default-cap bake.
I still kept the default at 200K, though. It's evidence from a single machine, a single run; whether it's stable on other Macs with less memory hasn't been verified. I just left the BAKE_MAX_FACES knob open.
G. The climax — SDPA vs naive attention, the sixth twist
Now the last one. In Part 2's profiling, I noted that 62.8% of structure sampling was dense attention. The varlen kernel was meaningless at B=1, but a flash-style Metal kernel for the dense path was still the single biggest chunk left. So I finally made up my mind to write the kernel myself.
But Part 2's lesson tripped me up: "Don't guess, measure." Before spending weeks writing a kernel, I decided to do a roofline measurement first — measuring the gap between the theoretical ceiling the hardware can reach and the current measured value — because that's the only way to know whether writing the kernel is worth it.
The measurement target was the actual shape of the structure stage: B=2, S=4096, H=12, D=128, bf16. I compared two implementations.
- fused SDPA: the
scaled_dot_product_attentionin use now. Apple's optimized fused kernel. - naive non-fused: a naive implementation that just calls QKᵀ matmul → softmax → V matmul separately.
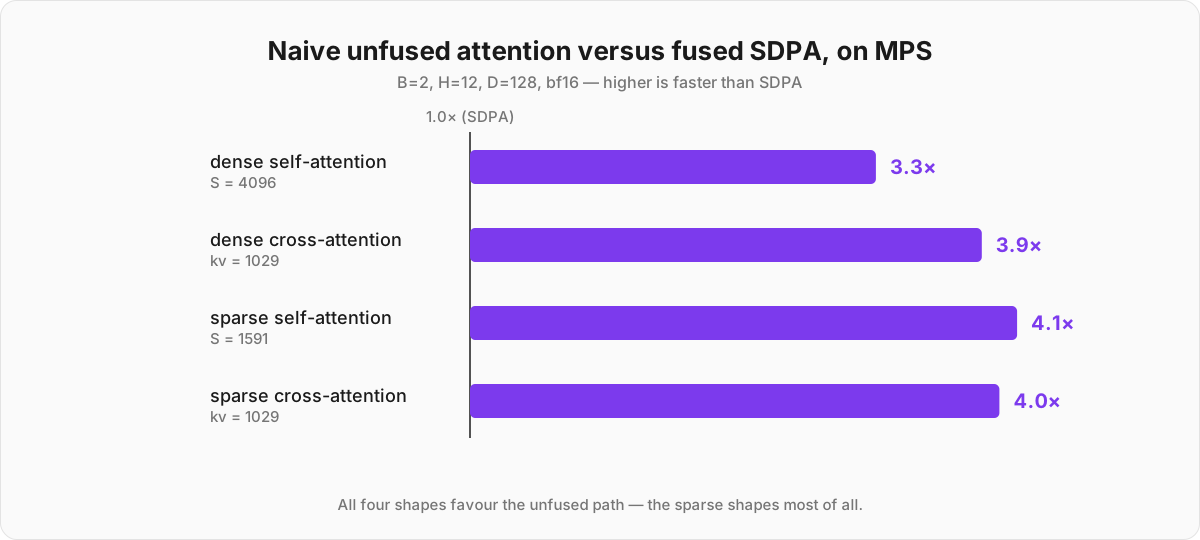
The result was the exact opposite of what I expected. The naive non-fused implementation was 3.3× faster than fused SDPA on self-attention, and 3.9× faster on cross-attention.
Hold on. What did I confidently declare at the end of Part 2? "MPS attention and matmul are already optimized by Apple. So don't try to naively rewrite them and beat them." — That conclusion was wrong, precisely on that dense shape. MPS's fused SDPA kernel was pathologically slow on this particular shape (large sequence, bf16).
Decompose the attention into two ordinary matmuls with a softmax between them, and those matmuls fell through to the MPSGraph kernels Apple really has optimized well — and it got more than 3× faster. "Apple optimized it" was true; the optimized path just wasn't the fused kernel I'd believed in.
The even better news: the naive backend already existed in the pinned upstream. I didn't even need to write a new kernel. Flipping one environment-variable default in core.py — ATTN_BACKEND=naive — was the whole thing.
Measured results (same heat window A/B, Brighella 512):
- structure sampling: 8.51s → 4.65–4.93s per step (about 1.75×)
- full generation: 211.5s → 166–174s (−19%)
- determinism exact-match across 2 runs, visual quality equal, no memory issues. Opt out with
ATTN_BACKEND=sdpa.
One real cost: the unfused path materializes an ~805MB bf16 S×S score tensor per self-attention call. On 32GB of unified memory that never mattered; on a smaller machine it would be the first thing to check.
The two runs, same harness, six hours apart — the only change is the sparse attention backend:
# ATTN_BACKEND=naive, SPARSE_ATTN_BACKEND=sdpa   (control)
Mesh: 512,907 vertices, 1,067,926 triangles
  Bake time: 8s
Total time: 160.3s generation + baking

# ATTN_BACKEND=naive, SPARSE_ATTN_BACKEND=naive  (test)
Mesh: 512,254 vertices, 1,065,930 triangles
  Bake time: 9s
Total time: 150.8s generation + baking
And this discovery killed the kernel-writing plan itself. Once I adopted naive, a custom flash kernel on top of it had only about 6% of end-to-end generation time left to win on the roofline. If weeks of Metal-kernel work buys 6% of the wall clock, the right move is not to do it.
The custom dense kernel was confirmed as another dead end too — only this time not because "SDPA is already optimal," but because "naive already took most of it."
Measuring the sparse side too
If a twist this big came out of the structure stage (dense attention), what about the shape and texture SLat stages (sparse attention)? There was no reason not to measure.
The shape is different — self-attention sequence length is 1,591 tokens (shorter than dense's 4,096), and cross-attention is based on 1,029 image-conditioning tokens. Yet the result went the same direction, and was actually larger. Naive beat SDPA on self-attention not by 3.3× but by about 4.1×, and on cross-attention not by 3.9× but by about 4.0×.
While investigating I found one more fun thing. The dense-side naive backend already had a real implementation upstream, so it was a one-line env var — but the sparse-side "naive" backend was actually just an alias for "sdpa"; there was no real non-fused implementation to begin with. Which means that until now, turning on naive on the sparse side did nothing at all.
I wrote in a real implementation — and because CFG batching always makes the two sequence lengths inside a batch identical (this is already where the "safe even without a padding mask" guarantee was secured), I didn't even need to rethink mask logic.
Measured results (same heat window, Brighella 512): shape SLat sampling −38% per step, texture SLat sampling −44% per step. Opt out with SPARSE_ATTN_BACKEND=sdpa.
Re-establishing the gate — when the number lands on the boundary
Naive attention computes attention in a different order of operations, so the floating-point result isn't bit-identical. With only dense changed, the gate re-established at 512,907 vertices / 1,067,926 triangles (exact match across 2 runs). But here came a methodologically interesting moment.
The triangle count was +1.05% versus the immediately preceding baseline (1,056,832). My gate band was ±1%. It crossed the boundary, just barely.
It would have been convenient to mechanically treat "over band = fail," but that forgets what the ±1% number was ever a proxy for. ±1% isn't an end in itself; it's a proxy set up to cheaply approximate "did the quality actually change." When a change lands right on the boundary, the proxy can't render a verdict.
In that case you have to go back to the real judge — comparing the renders with your own eyes.
So I rendered the sdpa version and the naive version from the same view and put them side by side. They were visually equivalent. Neither surface detail, silhouette, nor texture got meaningfully worse. So I accepted the +1.05%.
(As an aside, the vertex count of the post-bake GLB wobbles by ±several thousand run to run even from the same raw mesh, because of nondeterminism in xatlas/simplification. That's why the determinism verdict is always taken on the raw pre-bake "Mesh:" line — had I not known this, I'd have nearly misjudged perfectly good determinism as "broken.")
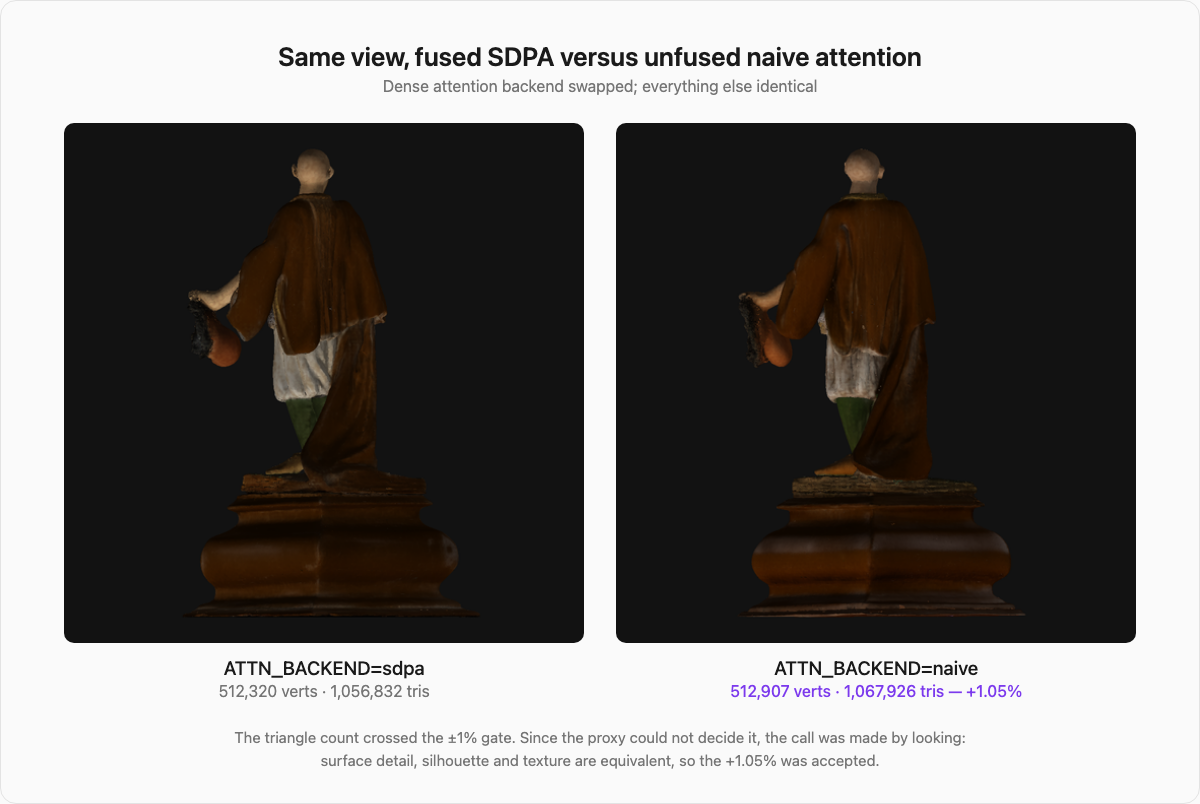
This is my favorite methodological moment of the campaign. The gate is a tool that lets you spin experiments fast, not a judge that renders the verdict for you. On the boundary, a human has to look.
Once I'd adopted the sparse side too, the gate moved one more time — 512,254 vertices / 1,065,930 triangles (2 runs bit-identical even 6 hours apart). This time it came in at −0.13% / −0.19% versus the prior, comfortably inside the band, so there was no boundary drama.
The final scorecard
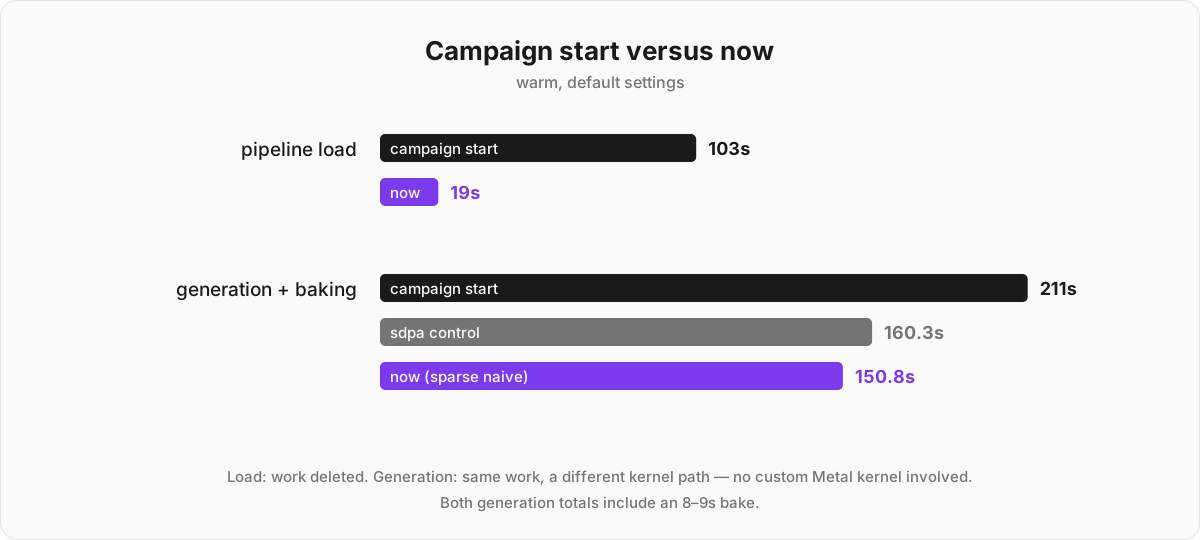
Putting the start of the campaign and now side by side (warm, default settings):
| segment | campaign start | now (default) |
|---|---|---|
| pipeline load | ~103s | ~19s (conditional loading + skip-init) |
| generation + baking | ~197–211s | 150.8s (sparse naive) vs 160.3s (sdpa control) |
- Load fell to under a fifth. Both skip-init and conditional loading are the result of deleting work that didn't need doing, not writing new code.
- Generation stacked up CFG batching (−7.8% of total) and dense naive attention (−19% of total). Sparse naive attention cut the shape and texture SLat sampling loops by 38% and 44% per step respectively — a large per-stage win, though those loops are a smaller slice of the total than the structure stage. End to end, that per-stage win shrinks a lot: the same-harness A/B run put sparse naive at 150.8s against 160.3s for the sdpa control — about 5.9% off the total, including an 8–9s bake in both. That gap between "38–44% per step" and "5.9% overall" is the whole point: the SLat sampling loops are a smaller slice of the pipeline than their per-step numbers suggest. The summary of this campaign is that the two biggest rooms came not from a Metal kernel but from one environment-variable default on the dense side — and, on the sparse side, from a ~100-line unfused branch that the backend had been silently aliasing away. Add
--steps 8fast mode and it bends down once more.
The default-setting optimizations (skip-init, conditional loading, CFG batching, mesh-extraction vectorization) are bit-identical or round-off level in output. Only dense/sparse naive attention and fast mode are "within ±1% (accepted after confirming visual equivalence)" tradeoffs.
One note on reading the series' numbers together: Part 2's resident-mode A/B (288.6s versus 306–340s) measured a full run from an earlier state of the code, before any of the wins above landed. The figures across the three posts are a descending timeline of the same pipeline, not competing measurements of the same thing.
Lessons
- The bottleneck you guess is almost always wrong — especially the one you're confident about. The five in Part 2, and the sixth conclusion I was so sure of in Part 3.
- "Optimized library" ≠ "the fast path for my shape." MPS's fused SDPA was pathologically slow on both the dense and sparse shapes, and two ordinary matmuls with a softmax between them were 3–4× faster every time.
- Measure the roofline before writing a kernel. By measuring the ceiling before mounting a weeks-long effort, I found a free −19% and confirmed — without a kernel — that it wasn't worth mounting one on top.
- Reproducibility isn't achieved by code alone (as the venv drift above already demonstrated) — so I left
requirements.lockand an upstream commit pin as rules. - The gate is a tool, not a judge. When it caught on the boundary (+1.05%), I threw out the proxy and judged by comparing with my eyes.
- A clean negative result is a deliverable too. For every dead end I left "why not" in numbers, so I never dug the same spot twice.
What's left
- Batch mode (E5). The scenario of processing several images in one process — the only case where the varlen kernel that was meaningless in Part 2 becomes valid (padding waste only arises when batch ≥ 2). The kernel is already installed, so only the wiring is left.
- Low-memory machines. Phase profiling put the peak at ~12–14GB and — surprisingly — during pipeline load, not sampling or baking, so the lever is checkpoint construction and dtype casting, not the bake cap. That says a 16GB machine may already have headroom, but I haven't validated it on one.
If this series leaves you with one thing when you're tuning performance on unfamiliar hardware, I'd want it to be this. Don't guess, measure. Especially where your intuition is most certain. I was certain six times and wrong six times, and what saved me each time wasn't better intuition — it was more honest measurement.
The code, the benchmark scripts, and every verification script that produced every number in this post are all public → github.com/sanchez-kim/trellis-silicon