Series: TRELLIS.2 on Apple Silicon (2/3) ← Part 1 · The Port — Part 2 · Measuring and the Dead Ends (this post) — Part 3 · What Actually Won →
In Part 1 I got a CUDA-only model running on Apple Silicon. Now it's time for performance. Let me give away the ending first — all five places where I bet "this will be the slow part" turned out to be wrong. This post is the record of those five wild misses.
How I measured — because otherwise it's all noise
Before talking about performance, I have to nail down the methodology first, because if you measure sloppily on MPS every number you get is a lie. And since the twists in this post all take the form of "a properly measured number betrayed my intuition," how I came to trust the measurements is half the story.
A time measured without synchronization is meaningless.
MPS is asynchronous, so any interval you time without wrapping it in torch.mps.synchronize() is just the moment the kernel got enqueued. So I wrapped every interval measurement in a sync (tools/profile_attn.py). The sync itself removes CPU/GPU overlap, which inflates absolute values by roughly 1.5x over reality, but the ratios between intervals stay valid.
I put up a determinism gate.
Fixing the seed to 42 means the output mesh comes out with a deterministic vertex/triangle count. The sample during the campaign was a shoe image, and the reference at that point was 427,301 vertices / 865,664 triangles.
(This number changes in Part 3 when I swap the sample image, but for now just think of it as "the exact fingerprint produced by a fixed seed.") Using that as the baseline:
- Changes that don't alter floating-point operation order → require a bit-exact match
- Changes that do alter order (batching, kernel swaps, etc.) → within ±1% + the GLB opens in trimesh and the PBR material exists
This gate is what gave the whole campaign its speed. No matter how aggressive a change was, I could judge it instantly with a single line: "is the mesh bit-identical?" With a seatbelt on, I could smash things fearlessly.
I always suspected thermal throttling.
Under sustained load, Apple Silicon makes the exact same code run 1.2–10x slower — with not a single line of the code path changed. So I ran A/B comparisons in fresh processes where possible, under similar thermal states, and normalized outliers by per-step rate to filter out artifacts. Without this discipline, several of this post's conclusions would have flipped.
In fact, there were several cases of "it looked slower, but it turned out it was just running hot."
Dead end 1: "The fused attention kernel will be the biggest bottleneck"
The original README itself pointed to SDPA-padded attention as "the biggest remaining bottleneck." At first I looked into writing a fused varlen (a scheme that efficiently packs variable-length sequences into one batch) Metal kernel by hand. I estimated it as weeks of work, and the up-front expected gain was "20–30% off the total."
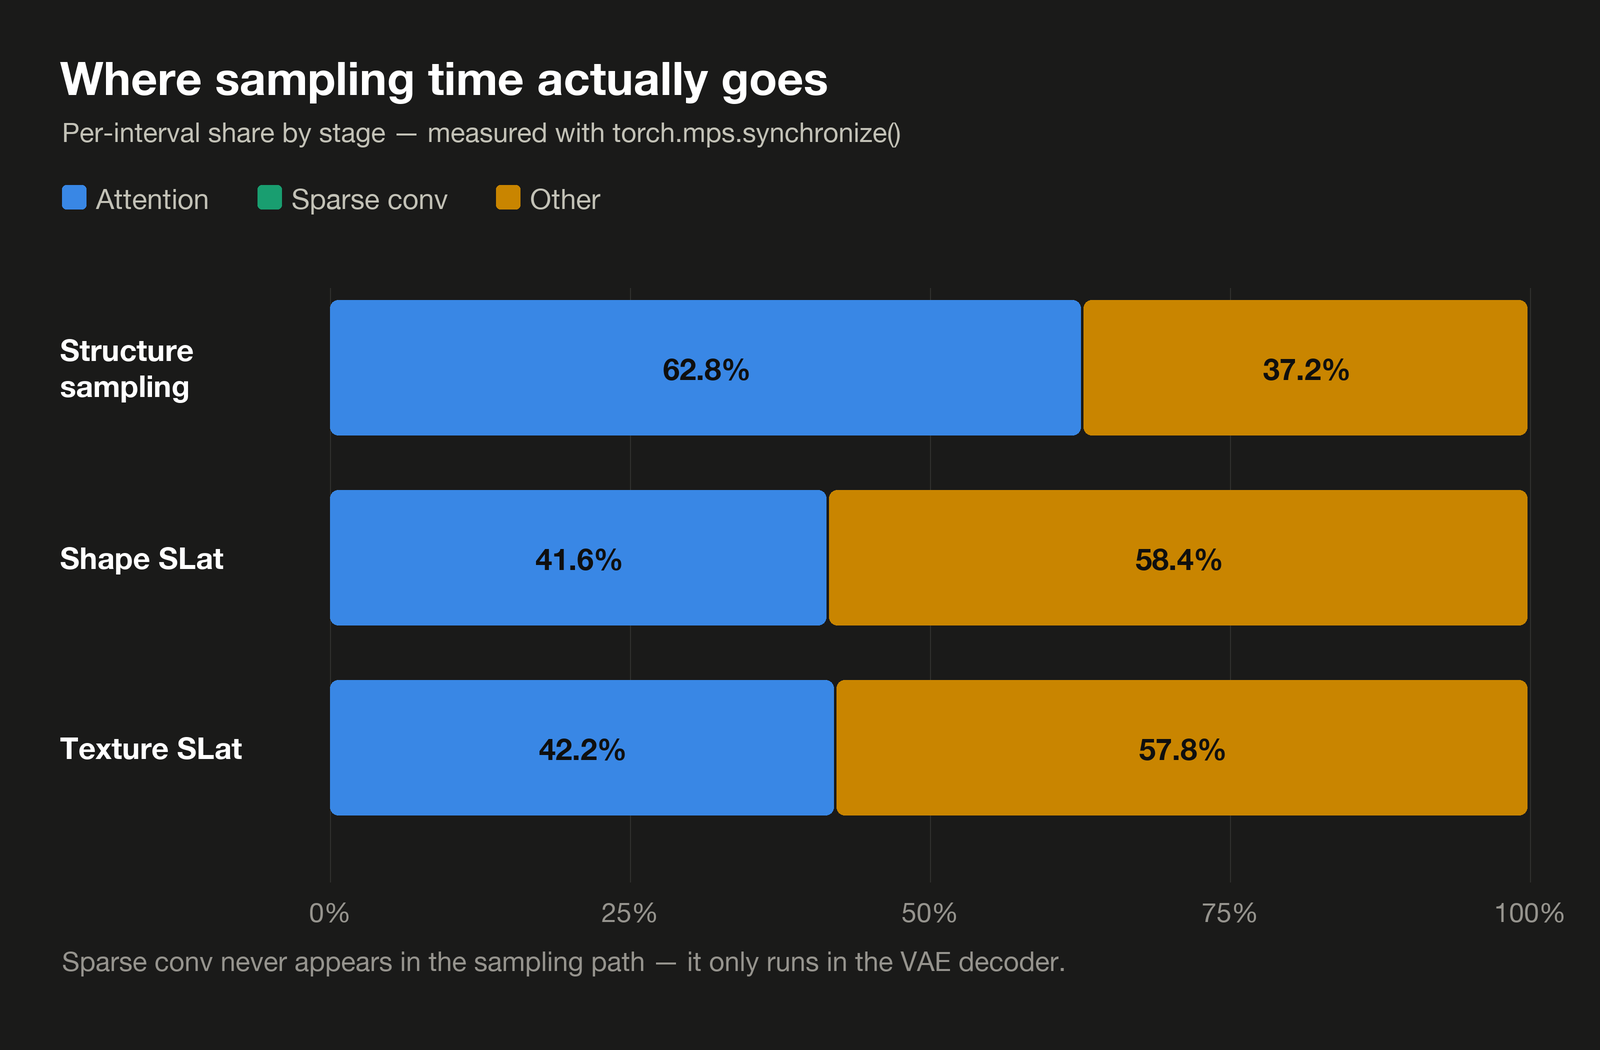
So before writing it, I profiled first. Here's the breakdown by interval into attention / sparse convolution / other.
| Stage | Attention | Sparse conv | Other |
|---|---|---|---|
| Structure sampling | 62.8% (dense attn) | 0% | 37.2% |
| Shape SLat | 41.6% | 0% | 58.4% |
| Texture SLat | 42.2% | 0% | 57.8% |
Three things flipped at once here.
First, the padding waste was exactly 0%. The reason a varlen kernel exists is to eliminate the waste created when you pad sequences of differing lengths into a single batch. But single-image inference has a batch of 1.
There are no other sequences to pad against, so active token count = padded token count (~1477 tokens per call), and the entire varlen logic becomes a no-op. The kernel's very reason for existing vanished.
Second, sparse convolution wasn't in the sampling path at all. SparseConv3d is exclusive to the VAE decoder, and the sampling stage is pure transformer. Optimizing the convolution wouldn't shave even a second off sampling time.
Third, the most expensive interval (structure-stage attention) was dense attention, not the varlen module. The share the varlen kernel I'd meant to spend weeks building could actually touch was a mere 2–3% of the total. Work canceled.
There was one more twist. While investigating the sibling project pedronaugusto/trellis2-apple, I discovered that a fused varlen Metal kernel (sparse_attention_fwd) was already installed in deps/mtlgemm, just never wired up. The code comment claimed "5–15x over SDPA."
I put up a "wire it if ≥1.5x" gate and measured it for real (our actual SDPA path and sequence lengths, N=1).
| seqlen | fp16 speedup | fp32 speedup |
|---|---|---|
| 1,477 | 0.64x | 0.24x |
| 4,096 | 0.55x | 0.23x |
| 8,192 | 0.76x | 0.24x |
| 16,384 | 0.78x | — |
It was slower than SDPA across the board. Gate missed, not wired. It's not that the "5–15x" was a lie — that number came from taking a slow SDPA (an MPS→CPU→MPS bounce) as the baseline on a workload of many short batched sequences with heavy padding waste.
Our torch 2.12.1 already has SDPA native on MPS, and our workload is a few long sequences with no padding waste, so the conditions themselves were different. Lesson: a benchmark claim means nothing until you re-measure it on your own workload.
Dead end 2: "The segment_reduce CPU fallback will hurt"
aten::segment_reduce isn't supported on MPS, so it spews a CPU-fallback warning. Round-tripping to the CPU in the middle of a GPU loop — it looked like a prime suspect. I measured it and — 36 calls total, 0.025 seconds combined, 0.01% of the whole. It's only called very rarely, in the CFG rescale branch.
How loud a warning is and how expensive a thing is are completely separate matters. This was noise.
Dead end 3: "The Python loop in SparseNorm will be slow"
SparseGroupNorm/SparseLayerNorm in norm.py were code that loops over batch elements in Python — an obvious antipattern at a glance. But a grep turned up — nowhere that instantiates these classes. It was dead code. The actual transformer blocks call dense LayerNorm32 directly on flat features, and that's already vectorized. I confirmed 0 calls to the loop class with the profiler too.
"Code that looks slow" and "code that actually runs" are different things.
Dead end 4: "Keeping the model resident (turning off low_vram) will be faster"
low_vram mode shuffles submodels between CPU and MPS at each stage. This .to() call clocked 32.7 seconds. So keeping the model resident on the GPU to eliminate this movement should win back exactly that much, right? — the measured A/B was the exact opposite. Resident mode was actually the same or slower (288.6s vs 306–340s).
The reason is amusing. The first CPU→GPU copy (first-touch H2D) is unavoidable at least once in either mode. What resident mode eliminates is only the cheap return trip afterward. Meanwhile, holding 9–11GB in unified memory the whole time means you pay a memory-pressure tax across the entire ~300-second sampling run.
On unified memory, the "cost of holding" outweighed the "cost of moving." I kept low_vram as the default and left only a --resident opt-in.
Dead end 5: "torch.compile will make it faster"
In the CUDA world, torch.compile is almost a free lunch. So naturally I figured it'd be a win here too. The measurements were a loss in all three directions.
First, re-measuring with a small probe (a transformer-like module, B=2×1477×512), inductor came in at a steady 13.11ms and eager at 4.08ms — 3.2x slower. A Not enough SMs to use max_autotune_gemm warning appeared, a signal that inductor's heuristics are written assuming CUDA (SM count) and misfire on MPS.
Moving to the real model (dense SparseStructureFlowModel, B=2 CFG batching) makes it even clearer.
- eager: 10,589 ms/forward
- inductor: steady 23,653 ms/forward = 0.45x (2.2x slower), and on top of that maxdiff 4.89e-2 (~5%), exceeding the ±1% gate
- inductor(fullgraph=True): the trace itself fails — the model's attention-backend selection logic uses Python
globals()(a global-variable lookup), and PyTorch's graph compiler (Dynamo) can't capture such a dynamic lookup into the graph
Why is it slow? MPS eager already dispatches to libraries Apple has optimized (MPSGraph's matmul/attention kernels). Inductor's naive Metal shader codegen can't beat that. In a transformer where matmul dominates, the loss from giving up the optimal kernel is larger than what you earn from fusion.
For a one-shot CLI, a 21.4-second compile cost is a net loss, and even for a resident server the steady state is 2.2x slower, so it wasn't even worth an opt-in. I didn't change a single line of code.
At this point I wrote down, with conviction, one lesson: "MPS attention and matmul are already optimized by Apple. So don't try to naively rewrite them and beat them." — it seemed like a reasonable conclusion. In Part 3 you'll see how this very sentence betrays me.
So where was the real bottleneck?
To sum up — all five places I bet on missed. The one the README pointed to, the ones common-sense reasoning suggested (CPU fallback, Python loops), the "already-built 5–15x kernel," and the intuitions that held on CUDA (resident model, torch.compile). Every one of them — and the more confidently I bet, the bigger I was wrong.
Only after five misses did my approach change. From here on, no more betting. Measure everything, exhaustively.
And once I did, the optimizations that actually won came from thoroughly unglamorous places — the side of "making it not do work it doesn't need to do." And at the very end of the campaign, a sixth twist was waiting — one that overturns even the conclusion I'd just stated with conviction in Part 2 ("MPS attention is already optimal").
That's the story of Part 3: What Actually Won.
The code and benchmark scripts are all public → github.com/sanchez-kim/trellis-silicon